Background: The American League and National League, which together form modern Major League Baseball, were segregated institutions until Jackie Robinson broke the baseball “color barrier” by joining the Brooklyn Dodgers in 1947. In response to this discrimination, a series of alternative professional baseball leagues formed for African-American players, which were known collectively as the “Negro Leagues.” After Jackie Robinson’s National League debut, other top Black players began to enter the American League and National League, eventually leading to the decline and dissolution of the Negro Leagues.
I am using a dataset I downloaded from the baseball data website Retrosheet (https://www.retrosheet.org/). This dataset contains all of Retrosheet’s current data on baseball games from the Negro Leagues. My research question is: how did Negro League baseball games change in 1948 and 1949, after Jackie Robinson broke the MLB color barrier in 1947? To answer the question, I’ll investigate the scoring environment (total runs scored per game) and attendance in the seasons immediately before and immediately after the integration of Major League Baseball.
import pandas as pd
import numpy as np
import matplotlib.pyplot as plt
game_info = pd.read_csv('gameinfo.csv')
game_info.head
<bound method NDFrame.head of                gid visteam hometeam   site      date  number starttime  \
0     PHG190309120     CUX      PHG  PHI10  19030912       0    0:00PM
1     CUX190309131     PHG      CUX  NYC18  19030913       1       NaN
2     PHG190309132     CUX      PHG  NYC18  19030913       2       NaN
3     CUX190309140     PHG      CUX  TRE02  19030914       0    0:00PM
4     PHG190309150     CUX      PHG  CAM02  19030915       0    0:00PM
...            ...     ...      ...    ...       ...     ...       ...
6316  ASW195808310     ASE      ASW  NYC16  19580831       0       NaN
6317  ASW195908090     ASE      ASW  CHI10  19590809       0       NaN
6318  ASW196008210     ASE      ASW  CHI10  19600821       0       NaN
6319  ASE196108200     ASW      ASE  NYC16  19610820       0    0:00PM
6320  ASW196208260     ASE      ASW  KAN05  19620826       0       NaN

     daynight  innings  tiebreaker  ... vruns hruns  wteam lteam line  \
0         day      NaN         NaN  ...     4     2    CUX   PHG    y
1         day      NaN         NaN  ...     1     8    CUX   PHG    y
2         day      NaN         NaN  ...     2     5    PHG   CUX    y
3         day      NaN         NaN  ...     1     3    CUX   PHG    y
4         day      NaN         NaN  ...     0     3    PHG   CUX    y
...       ...      ...         ...  ...   ...   ...    ...   ...  ...
6316      day      NaN         NaN  ...     6     5    ASE   ASW    y
6317      day      NaN         NaN  ...     7     8    ASW   ASE    y
6318      day      NaN         NaN  ...     4     8    ASW   ASE    y
6319      day      NaN         NaN  ...     7     1    ASW   ASE    y
6320      day      NaN         NaN  ...     2     5    ASW   ASE    y

     batteries lineups  box  pbp  season
0         both       y    y    d    1903
1         both       y    y  NaN    1903
2         both       y    y  NaN    1903
3         both       y    y    d    1903
4         both       y    y    d    1903
...        ...     ...  ...  ...     ...
6316      both     NaN  NaN  NaN    1958
6317      both     NaN  NaN  NaN    1959
6318      both     NaN  NaN  NaN    1960
6319      both       y    y    y    1961
6320      both     NaN  NaN  NaN    1962

[6321 rows x 42 columns]>
# Add a totalruns column to this dataset:
game_info['totalruns'] = game_info['vruns'] + game_info['hruns']
game_info.head
<bound method NDFrame.head of                gid visteam hometeam   site      date  number starttime  \
0     PHG190309120     CUX      PHG  PHI10  19030912       0    0:00PM
1     CUX190309131     PHG      CUX  NYC18  19030913       1       NaN
2     PHG190309132     CUX      PHG  NYC18  19030913       2       NaN
3     CUX190309140     PHG      CUX  TRE02  19030914       0    0:00PM
4     PHG190309150     CUX      PHG  CAM02  19030915       0    0:00PM
...            ...     ...      ...    ...       ...     ...       ...
6316  ASW195808310     ASE      ASW  NYC16  19580831       0       NaN
6317  ASW195908090     ASE      ASW  CHI10  19590809       0       NaN
6318  ASW196008210     ASE      ASW  CHI10  19600821       0       NaN
6319  ASE196108200     ASW      ASE  NYC16  19610820       0    0:00PM
6320  ASW196208260     ASE      ASW  KAN05  19620826       0       NaN

     daynight  innings  tiebreaker  ... hruns wteam  lteam line batteries  \
0         day      NaN         NaN  ...     2   CUX    PHG    y      both
1         day      NaN         NaN  ...     8   CUX    PHG    y      both
2         day      NaN         NaN  ...     5   PHG    CUX    y      both
3         day      NaN         NaN  ...     3   CUX    PHG    y      both
4         day      NaN         NaN  ...     3   PHG    CUX    y      both
...       ...      ...         ...  ...   ...   ...    ...  ...       ...
6316      day      NaN         NaN  ...     5   ASE    ASW    y      both
6317      day      NaN         NaN  ...     8   ASW    ASE    y      both
6318      day      NaN         NaN  ...     8   ASW    ASE    y      both
6319      day      NaN         NaN  ...     1   ASW    ASE    y      both
6320      day      NaN         NaN  ...     5   ASW    ASE    y      both

     lineups  box  pbp season  totalruns
0          y    y    d   1903          6
1          y    y  NaN   1903          9
2          y    y  NaN   1903          7
3          y    y    d   1903          4
4          y    y    d   1903          3
...      ...  ...  ...    ...        ...
6316     NaN  NaN  NaN   1958         11
6317     NaN  NaN  NaN   1959         15
6318     NaN  NaN  NaN   1960         12
6319       y    y    y   1961          8
6320     NaN  NaN  NaN   1962          7

[6321 rows x 43 columns]>
# Slice out the columns we don't care about in order to make the data set easier to work with
game_info_sliced = game_info[['gid', 'visteam', 'hometeam', 'attendance', 'gametype', 'vruns', 'hruns', 'season', 'totalruns']]
game_info_sliced.head
<bound method NDFrame.head of                gid visteam hometeam attendance      gametype  vruns  hruns  \
0     PHG190309120     CUX      PHG       3887  championship      4      2
1     CUX190309131     PHG      CUX       3000  championship      1      8
2     PHG190309132     CUX      PHG       8000  championship      2      5
3     CUX190309140     PHG      CUX       2500  championship      1      3
4     PHG190309150     CUX      PHG       3000  championship      0      3
...            ...     ...      ...        ...           ...    ...    ...
6316  ASW195808310     ASE      ASW        NaN       allstar      6      5
6317  ASW195908090     ASE      ASW       8923       allstar      7      8
6318  ASW196008210     ASE      ASW       5000       allstar      4      8
6319  ASE196108200     ASW      ASE       7245       allstar      7      1
6320  ASW196208260     ASE      ASW        NaN       allstar      2      5

      season  totalruns
0       1903          6
1       1903          9
2       1903          7
3       1903          4
4       1903          3
...      ...        ...
6316    1958         11
6317    1959         15
6318    1960         12
6319    1961          8
6320    1962          7

[6321 rows x 9 columns]>
# Create a filter that selects only the regular season games from the 1949 season. Save as a new DataFrame, forty_nine.
forty_nine_filter = game_info_sliced['season'] == 1949
regular_season_filter = game_info_sliced['gametype'].str.contains('regular')
forty_nine = game_info_sliced[forty_nine_filter & regular_season_filter]
forty_nine.head
<bound method NDFrame.head of                gid visteam hometeam attendance gametype  vruns  hruns  season  \
5891  BIR194904300     HOE      BIR       4636  regular      1      3    1949
5892  BLG194905011     KCM      BLG       5588  regular      5      3    1949
5893  BLG194905012     KCM      BLG       5588  regular      1      5    1949
5894  LCB194905010     PH5      LCB       3350  regular      1      2    1949
5895  BIR194905020     HOE      BIR          0  regular      3      2    1949
...            ...     ...      ...        ...      ...    ...    ...     ...
6265  CAG194909052     IN9      CAG        NaN  regular      0      2    1949
6266  KCM194909051     NY6      KCM       2500  regular      6      5    1949
6267  KCM194909052     NY6      KCM       2500  regular      2      0    1949
6268  MEM194909051     BIR      MEM        NaN  regular      0      1    1949
6269  MEM194909052     BIR      MEM        NaN  regular      1      8    1949

      totalruns
5891          4
5892          8
5893          6
5894          3
5895          5
...         ...
6265          2
6266         11
6267          2
6268          1
6269          9

[370 rows x 9 columns]>
# Now do the same for '48:
forty_eight_filter = game_info_sliced['season'] == 1948
forty_eight = game_info_sliced[forty_eight_filter & regular_season_filter]
forty_eight.head
<bound method NDFrame.head of                gid visteam hometeam attendance gametype  vruns  hruns  season  \
5323  HOM194804290     BLG      HOM        NaN  regular      3      8    1948
5326  BIR194805010     CVB      BIR       8000  regular      2     11    1948
5327  PH5194805010     NY6      PH5          0  regular     17      9    1948
5328  BIR194805021     CVB      BIR       6117  regular      9      7    1948
5329  BIR194805022     CVB      BIR       6117  regular      6      7    1948
...            ...     ...      ...        ...      ...    ...    ...     ...
5806  CVB194809090     CAG      CVB        400  regular      0      3    1948
5807  IN9194809090     KCM      IN9       1500  regular      9      4    1948
5811  BLG194809121     NW2      BLG          0  regular      5      1    1948
5812  BLG194809122     NW2      BLG        NaN  regular      8      2    1948
5817  NY6194809120     PH5      NY6       3200  regular     10      8    1948

      totalruns
5323         11
5326         13
5327         26
5328         16
5329         13
...         ...
5806          3
5807         13
5811          6
5812         10
5817         18

[422 rows x 9 columns]>
# Now do the same for '47:
forty_seven_filter = game_info_sliced['season'] == 1947
forty_seven = game_info_sliced[forty_seven_filter & regular_season_filter]
forty_seven.head
<bound method NDFrame.head of                gid visteam hometeam attendance gametype  vruns  hruns  season  \
4742  HOM194705031     NY6      HOM        NaN  regular      2      0    1947
4743  HOM194705032     NY6      HOM        NaN  regular      4      9    1947
4746  BLG194705041     PH5      BLG       6800  regular      4      1    1947
4747  BLG194705042     PH5      BLG       6800  regular      2      7    1947
4748  CVB194705040     BIR      CVB       6623  regular      4      9    1947
...            ...     ...      ...        ...      ...    ...    ...     ...
5266  NY6194709190     CVB      NY6       5500  regular      5      5    1947
5269  NY6194709210     CVB      NY6       9000  regular     10      7    1947
5271  CVB194709230     NY6      CVB       6000  regular      6      0    1947
5274  NY6194709240     CVB      NY6       1739  regular      4      9    1947
5281  CVB194709270     NY6      CVB       4500  regular      6      5    1947

      totalruns
4742          2
4743         13
4746          5
4747          9
4748         13
...         ...
5266         10
5269         17
5271          6
5274         13
5281         11

[438 rows x 9 columns]>
# Now the last year I'll look at, '46:
forty_six_filter = game_info_sliced['season'] == 1946
forty_six = game_info_sliced[forty_six_filter & regular_season_filter]
forty_six.head
<bound method NDFrame.head of                gid visteam hometeam attendance gametype  vruns  hruns  season  \
4163  BLG194605051     HOM      BLG       6729  regular      9      8    1946
4164  BLG194605052     HOM      BLG       6729  regular      7      8    1946
4165  CAG194605051     KCM      CAG      12000  regular      2      9    1946
4166  CAG194605052     KCM      CAG      12000  regular      4      3    1946
4167  CVB194605051     BIR      CVB       8364  regular      1      2    1946
...            ...     ...      ...        ...      ...    ...    ...     ...
4651  BLG194609151     NW2      BLG       3500  regular     12     13    1946
4652  BLG194609152     NW2      BLG       3500  regular      3      6    1946
4653  HOM194609151     NY6      HOM        NaN  regular      3      8    1946
4654  HOM194609152     NY6      HOM        NaN  regular      1      2    1946
4655  MEM194609150     CAG      MEM        NaN  regular     12      9    1946

      totalruns
4163         17
4164         15
4165         11
4166          7
4167          3
...         ...
4651         25
4652          9
4653         11
4654          3
4655         21

[407 rows x 9 columns]>
# Let's start with a simple plot of mean totalruns over time
x = [1946, 1947, 1948, 1949]
y = [forty_six['totalruns'].mean(), forty_seven['totalruns'].mean(), forty_eight['totalruns'].mean(), forty_nine['totalruns'].mean()]
plt.axis([1946, 1949, 6, 12])
plt.xticks(np.arange(1946, 1950, step=1))
plt.yticks(np.arange(6, 12, step=0.5))
plt.plot(x, y)
[<matplotlib.lines.Line2D at 0x278f5866790>]

# Now, make a box plot of total runs by year:

data = [forty_six['totalruns'], forty_seven['totalruns'], forty_eight['totalruns'], forty_nine['totalruns']]

plt.boxplot(data)
plt.xticks([1, 2, 3, 4], ['1946', '1947', '1948', '1949'])
plt.show()

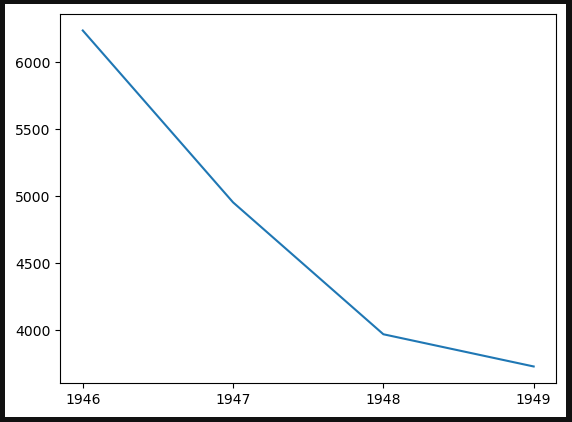
Now, let’s check to see whether attendance decreased over these seasons as some of the Negro League’s biggest stars transitioned to the American and National Leagues.
# First, drop the NaN attendance values from all of our dataframes:
forty_six = forty_six.dropna(subset=['attendance'])
forty_seven = forty_seven.dropna(subset=['attendance'])
forty_eight = forty_eight.dropna(subset=['attendance'])
forty_nine = forty_nine.dropna(subset=['attendance'])
forty_six.loc[:, ('attendance')] =  forty_six[['attendance']].astype(str).astype(int)
forty_seven.loc[:, ('attendance')] =  forty_seven[['attendance']].astype(str).astype(int)
forty_nine.loc[:, ('attendance')] =  forty_nine[['attendance']].astype(str).astype(int)
# forty_eight needs a bit more attention, because some of its attendance values include non-digits
forty_eight.loc[:, ('attendance')] = forty_eight[['attendance']].astype(str)
forty_eight.dtypes
gid           object
visteam       object
hometeam      object
attendance    object
gametype      object
vruns          int64
hruns          int64
season         int64
totalruns      int64
dtype: object
# Now, let's find and replace the non-digit characters inside the forty_eight attendance numbers
forty_eight.loc[:, ('attendance')] = forty_eight['attendance'].str.replace(">", "")
forty_eight.loc[:, ('attendance')] = forty_eight['attendance'].str.replace("<", "")
forty_eight.loc[:, ('attendance')] = forty_eight['attendance'].str.replace("?", "")
forty_eight.loc[:, ('attendance')] = forty_eight[['attendance']].astype(int)
# Finally, we need to drop all rows from each data frame in which attendance is listed as zero.
mask = forty_six['attendance'] == 0
forty_six = forty_six[~mask]
mask = forty_seven['attendance'] == 0
forty_seven = forty_seven[~mask]
mask = forty_eight['attendance'] == 0
forty_eight = forty_eight[~mask]
mask = forty_nine['attendance'] == 0
forty_nine = forty_nine[~mask]
x = [1946, 1947, 1948, 1949]
y = [forty_six['attendance'].mean(), forty_seven['attendance'].mean(), forty_eight['attendance'].mean(), forty_nine['attendance'].mean()]
# plt.axis([1946, 1949, 6, 12])
plt.xticks(np.arange(1946, 1950, step=1))
# plt.yticks(np.arange(6, 12, step=0.5))
plt.plot(x, y)
[<matplotlib.lines.Line2D at 0x278f58670d0>]

# And let's round things out with a boxplot:

data = [forty_six['attendance'], forty_seven['attendance'], forty_eight['attendance'], forty_nine['attendance']]

plt.boxplot(data)
plt.xticks([1, 2, 3, 4], ['1946', '1947', '1948', '1949'])
plt.show()

